How to inspect AI requests in BoltAI
Written By Daniel Nguyen
Last updated 2 months ago
Sometimes your AI request might fail without a useful error message. Most of the time, this is due to the AI provider doesn’t accept our request from BoltAI.
Please follow this short guide and help me debug the issue.
Install Proxyman
Proxyman is a high-performance network debugging proxy tool for macOS (and other platforms like iOS, Windows, Linux) that lets developers capture, inspect, and modify HTTP/HTTPS traffic from apps and devices, acting as a middleman to intercept requests and responses for analysis and testing.
It provides a modern interface to see network activity, debug issues, and even mock responses, making it useful for web and mobile development.
We will use Proxyman to inspect the network request from BoltAI.
Download Proxyman. You just need the trial version.
Install and trust Proxyman Certificates on your Mac (guide)
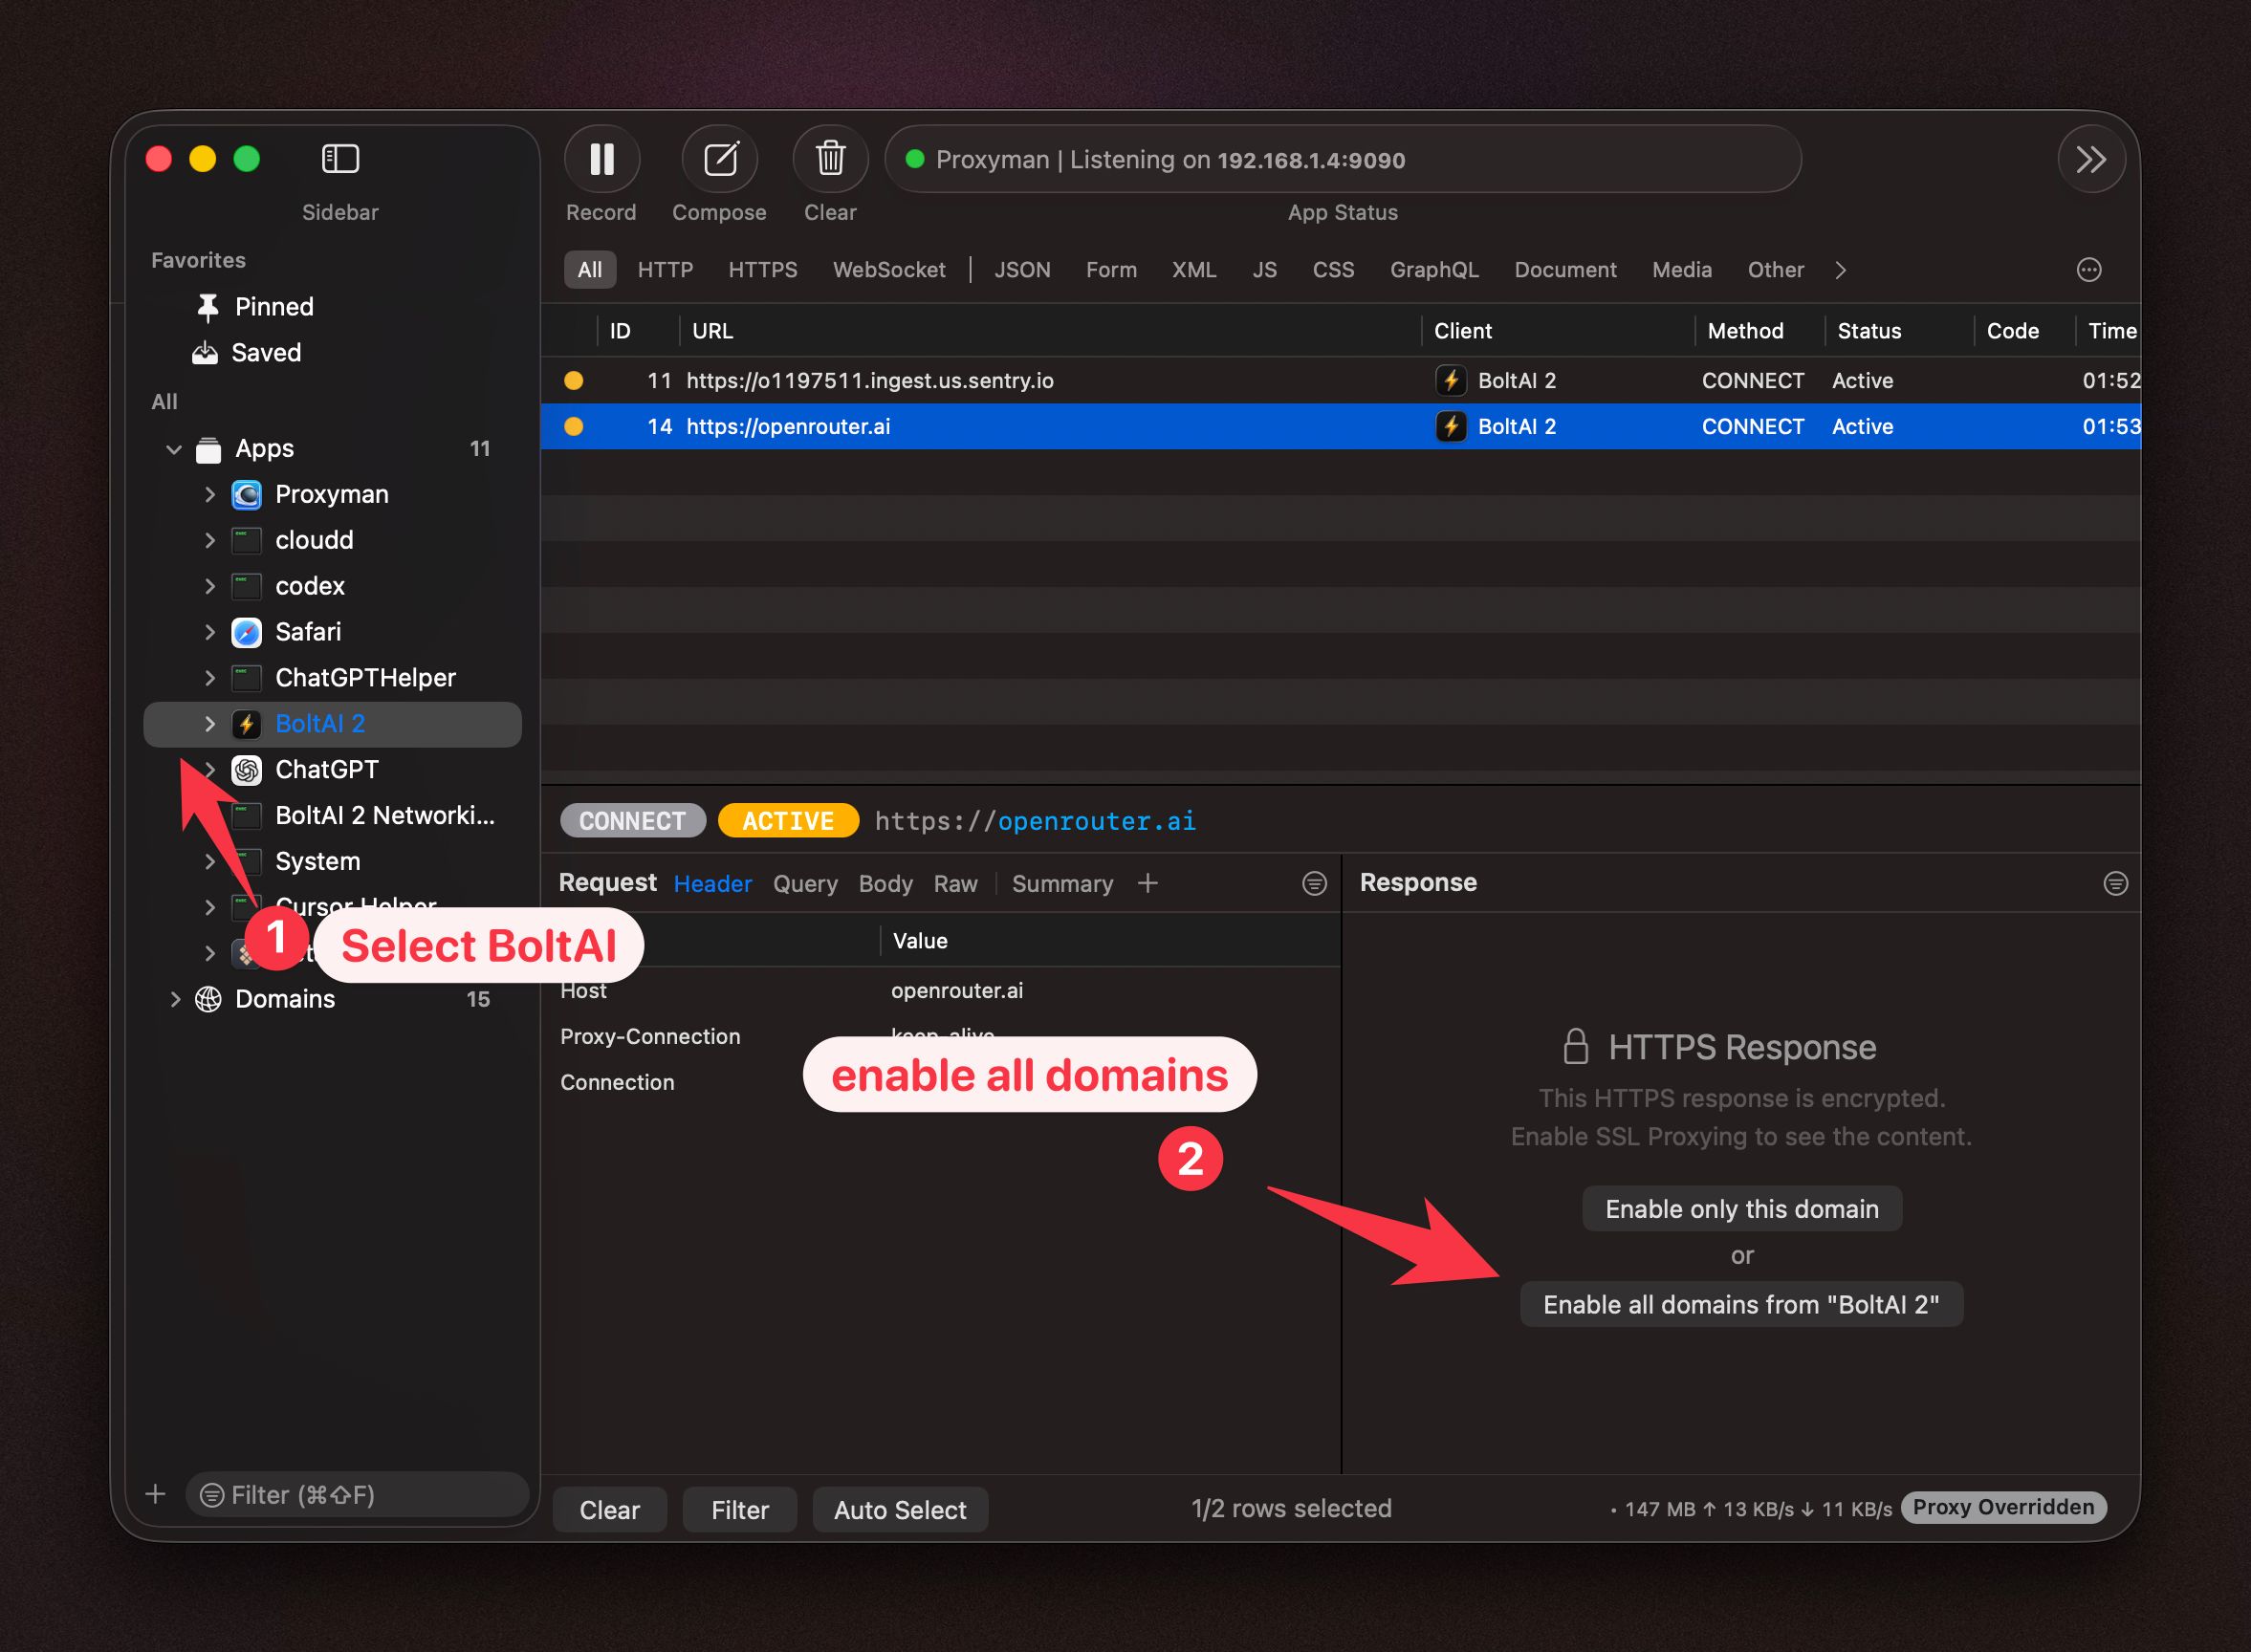
Send a message in BoltAI. In Proxyman, find BoltAI 2 in the sidebar (1), click Enable all domain from “BoltAI 2” (2)
Note: it’s ok if the request fails.

Inspect BoltAI request
Start Proxyman and make sure the proxy is on.
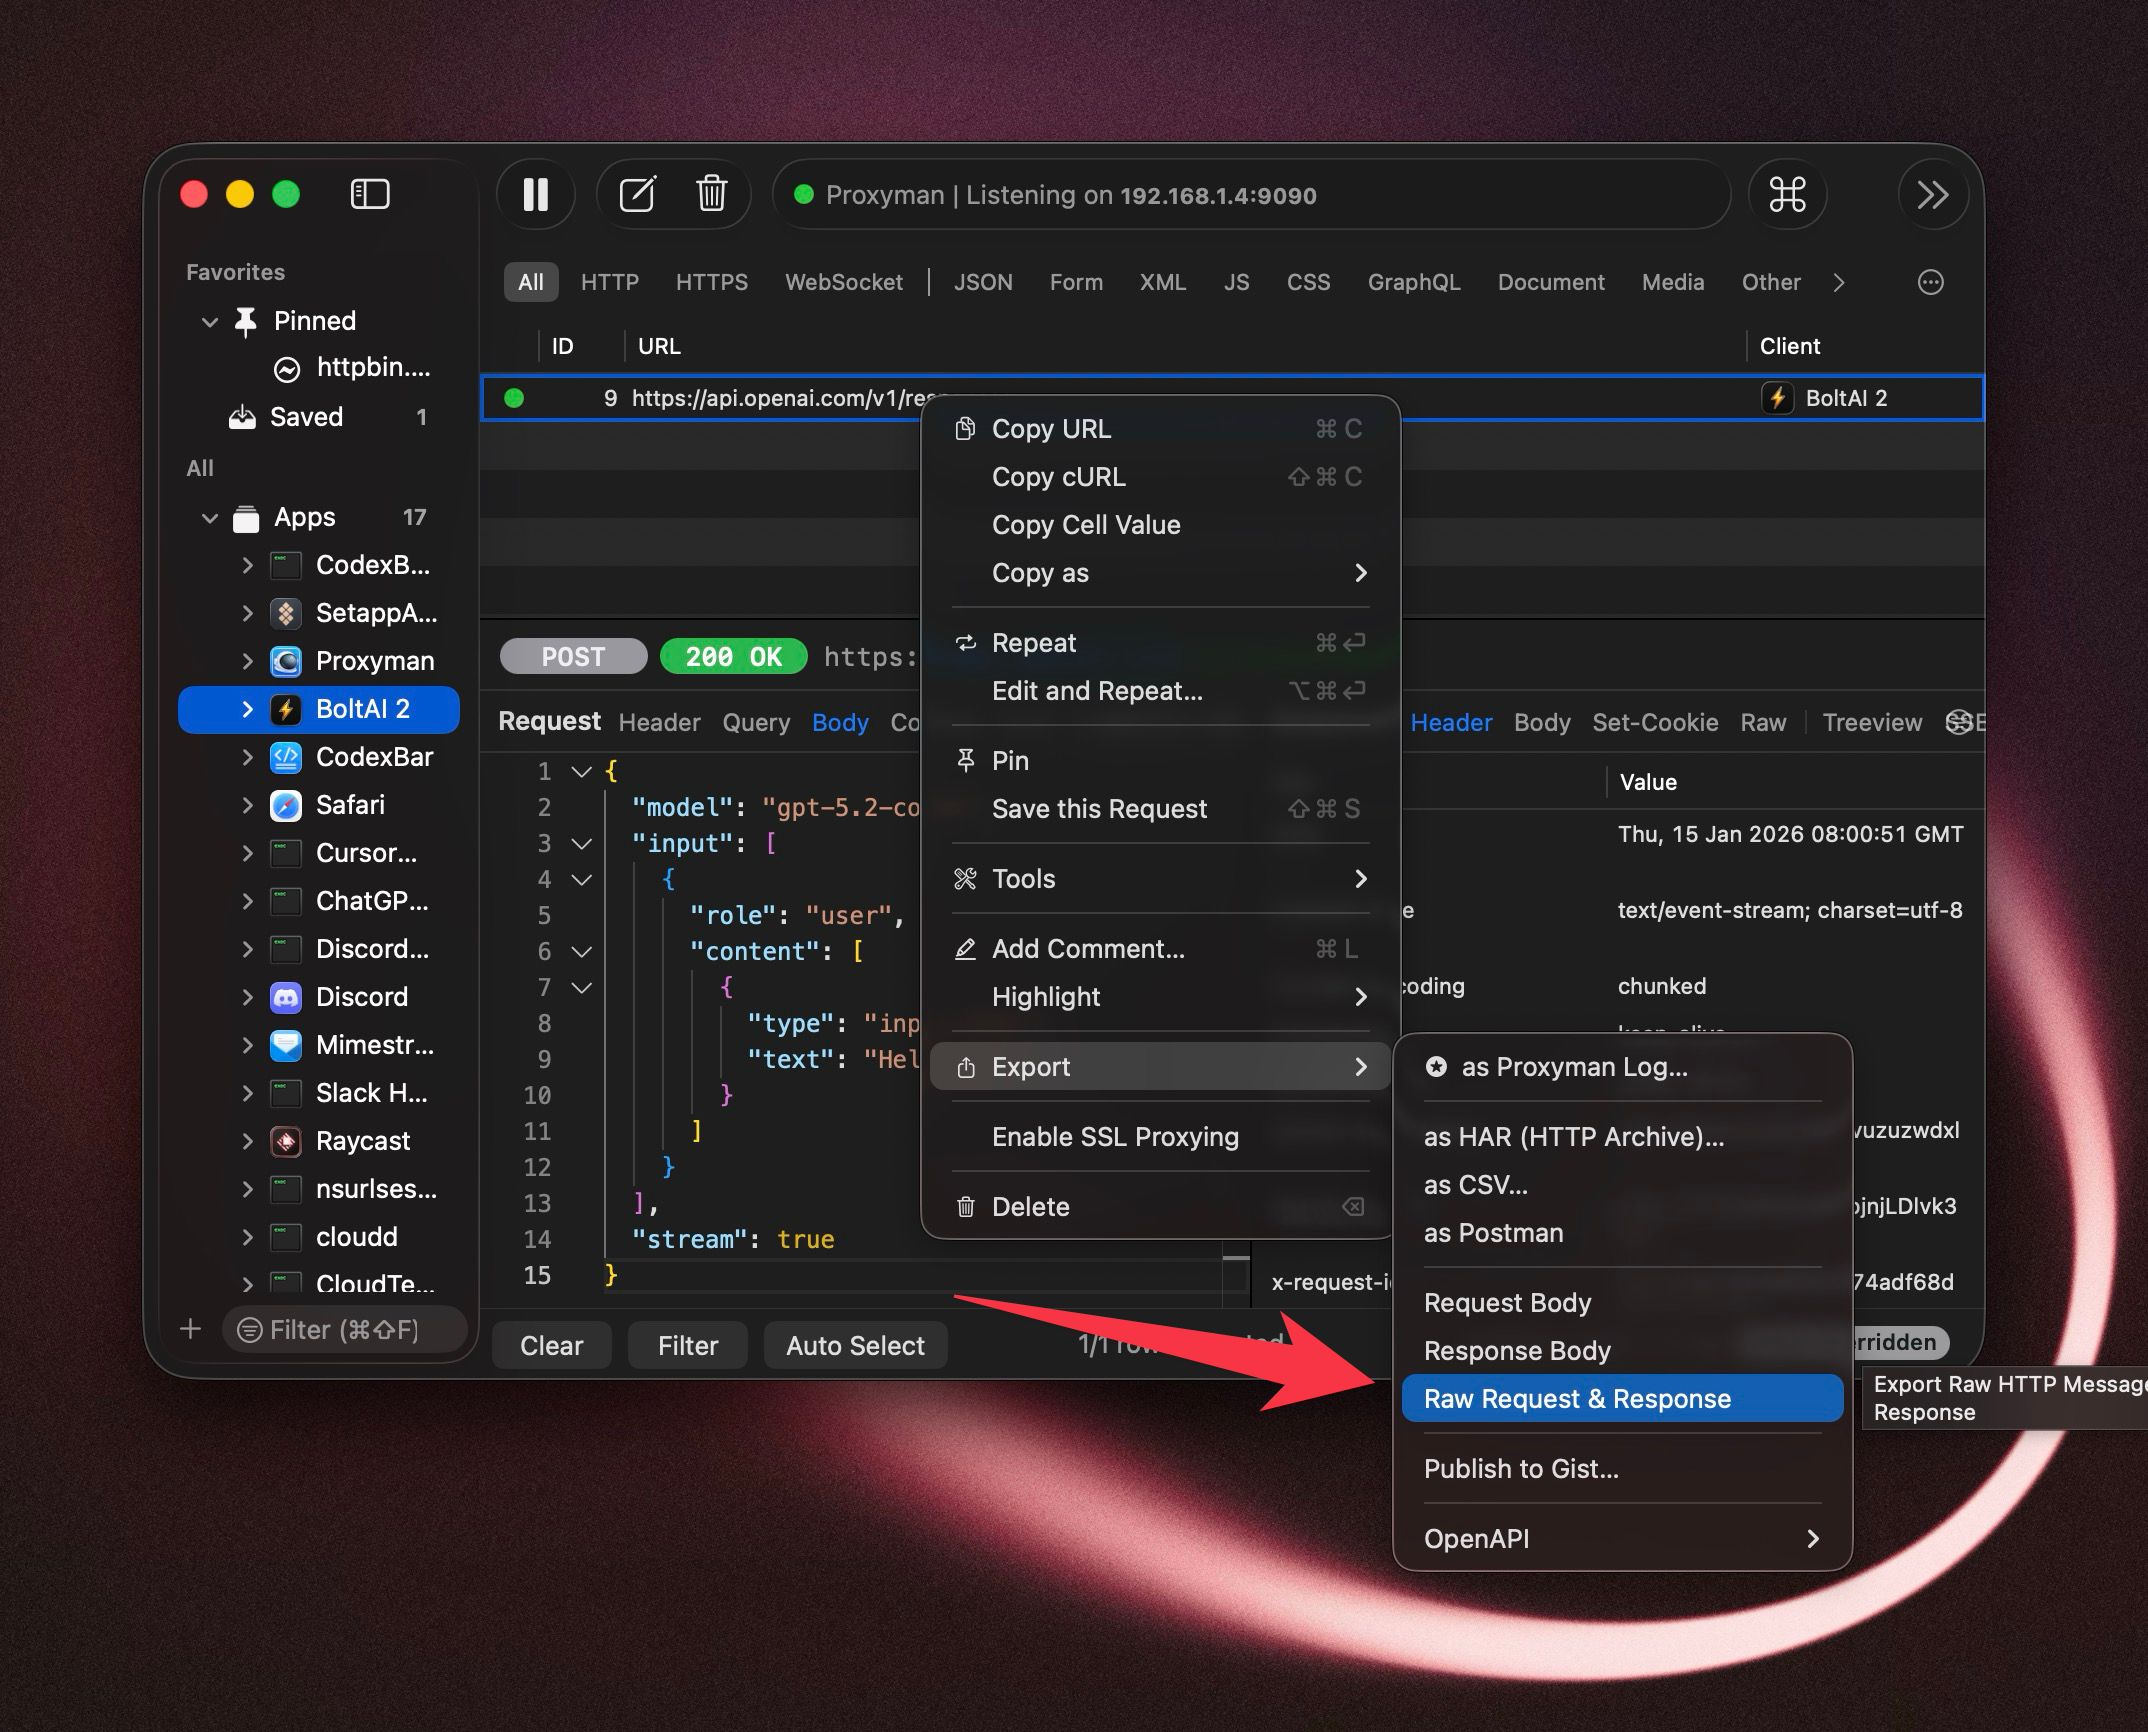
Open BoltAI and send a message / initiate a network request. You should find the request in Proxyman (screenshot).
Right click on the request, select Export > Raw Request & Response
(Optional) Open the exported files and redact sensitive data in the request such as API key or Authorization header.
Share the exported files with me via email hello@boltaisupport.com

Debug the request yourself with Proxyman
You can also debug the request yourself in Proxyman. Follow the same step 1 & 2 above. Then:
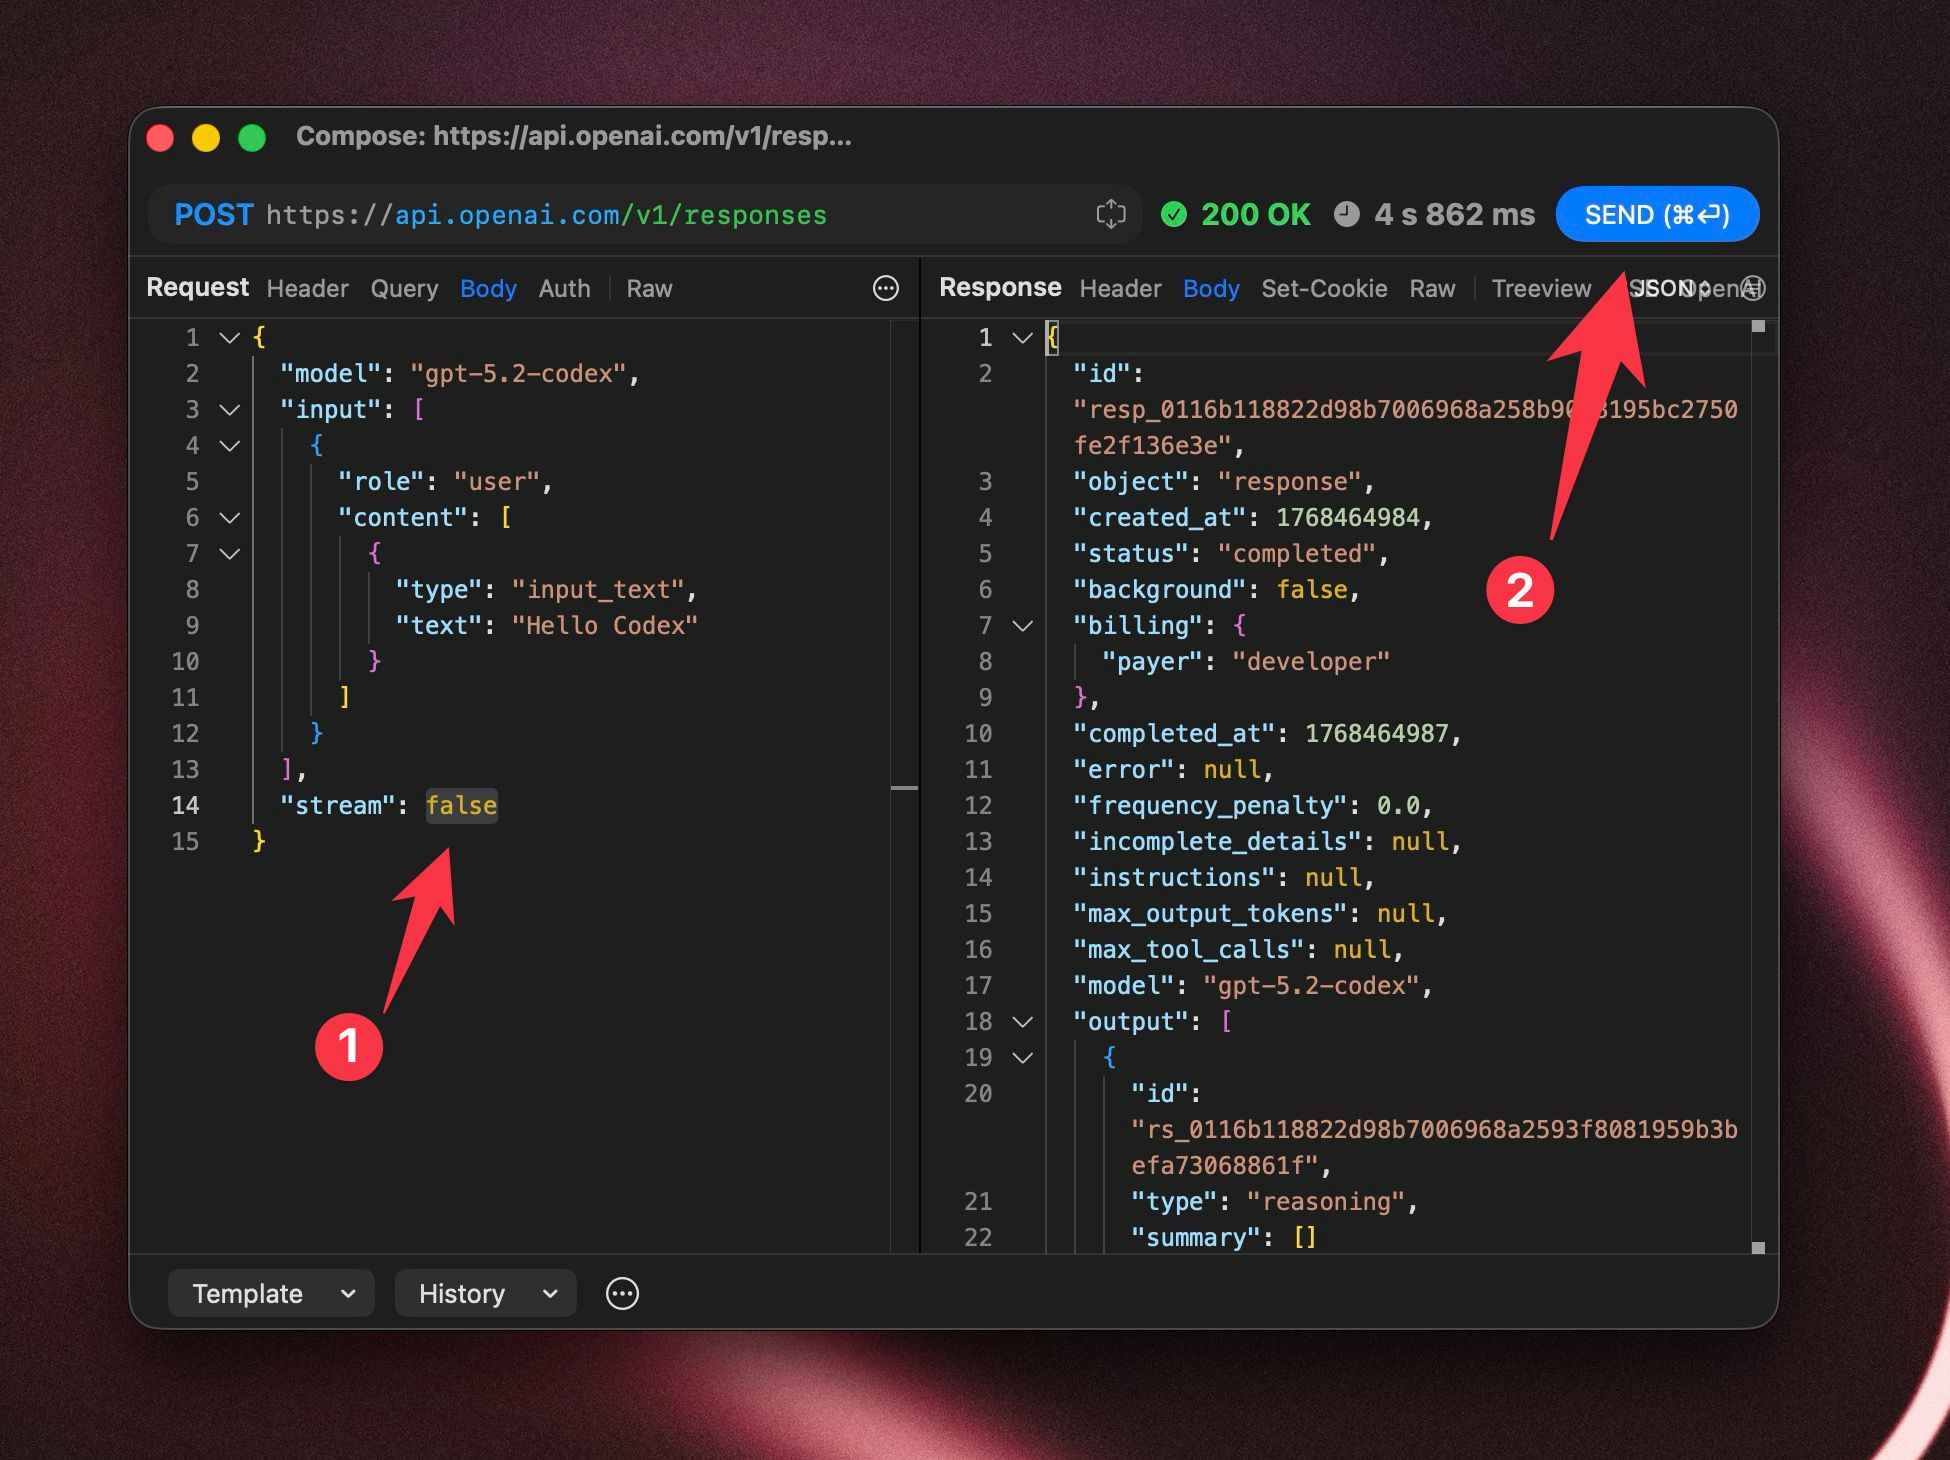
Right click on the request, select “Edit and Repeat…”
Edit the request body on the left pane and click SEND
